How to use it
Sustainable Trade Index 2024
Published 04 February 2025
The Hinrich-IMD Sustainable Trade Index 2024 highlights the vital link between global trade and the need for economic, societal, and environmental resilience. In an era marked by disruptions such as geopolitical tensions, economic instability, climate change, and health crises, the index underscores the need for adopting sustainable trade practices and provides insights for policymakers and the wider community in trade.
Why is the Sustainable Trade Index important?
The Sustainable Trade Index (STI) is an essential tool for assessing how trade fosters sustainable development. It evaluates 30 global trading economies using 72 economic, societal, and environmental indicators, providing insights into how trade activities align with sustainable goals. The STI helps policymakers and businesses identify the best practices and areas for improvement, promoting trade that benefits both people and the environment.
By considering indicators like carbon emissions, labor standards, and trade costs, the STI underscores the connections between trade and sustainability, encouraging nations to adopt responsible trade strategies. The index ranks countries based on their performance, offering a clear picture of their sustainability efforts and needed actions. For businesses, the STI serves as a framework to align operations with global sustainability standards, ensuring positive contributions to the environment and society. Additionally, the STI acts as a benchmarking tool, enabling countries to compare their progress with others.
What’s in the Sustainable Trade Index 2024?
The Sustainable Trade Index 2024 includes the following materials for download:

STI report: Introduction
The STI 2024 report identifies three key trends:
- A protectionist reconfiguration of the global trade landscape: Countries are increasingly turning to industrial policy regardless of whether it is sustainable in the long term. Across the 30 economies analyzed, tariff barriers jumped from approximately 19,000 in 2023 to 21,500 in 2024; non-tariff barriers have risen from 392,000 in 2023 to 483,000 in 2024. (p. 9)
- Enhancing workforce resilience has knock-on effects on global trade: a resilient workforce that can adapt to rapid changes and cope with setbacks is instrumental to achieve sustainable growth. Key components measured include Universal Health Coverage, educational attainment, and the mitigation of forced labor; these measures aim to create a more adaptable workforce and promote societal well-being, aligning economic growth with social justice. (p. 9)
- Improving environmental sustainability while enhancing trade: The urgency of addressing climate change is central to many industrial policies today; initiatives like the EU Carbon Border Adjustment Mechanism (CBAM), the US Inflation Reduction Act (IRA), Canada’s Net-Zero Emissions Accountability Act, and Japan’s Green Growth Strategy aim for carbon neutrality while aligning with SDGs; in July 2024, trade ministers from Costa Rica, Iceland, New Zealand, and Switzerland concluded the Agreement on Climate Change, Trade, and Sustainability (ACCTS), aiming to eliminate tariffs on environmental goods and facilitate trade in environmental services. The STI tracked international conventions addressing climate externalities, showing a clear trend of more countries ratifying and implementing these conventions. (p. 10)
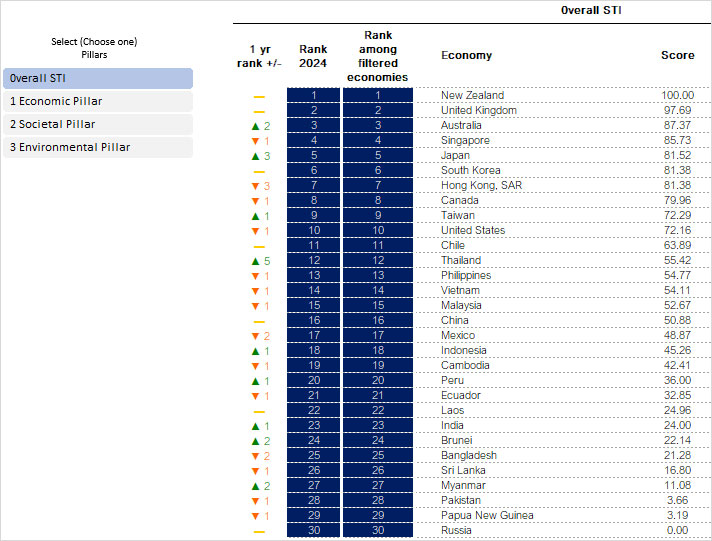
Interactive excel index
The interactive excel index provides comprehensive insights on indicator data and economy rankings in the STI.
- Under the Ranking tab, one can view the overall rankings, individual pillar rankings (economic, societal, and environmental), and scores of each economy.
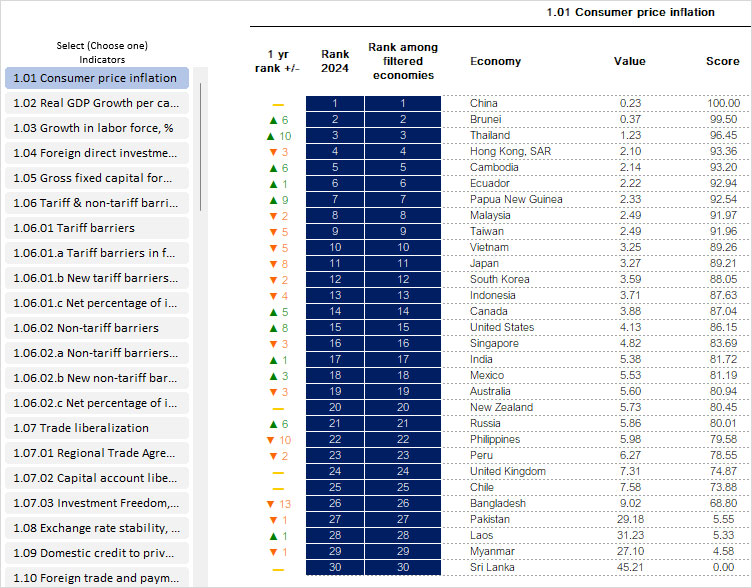
- Under the Indicators tab, the respective economy rankings and their data values and index scores can be viewed by selecting an indicator.
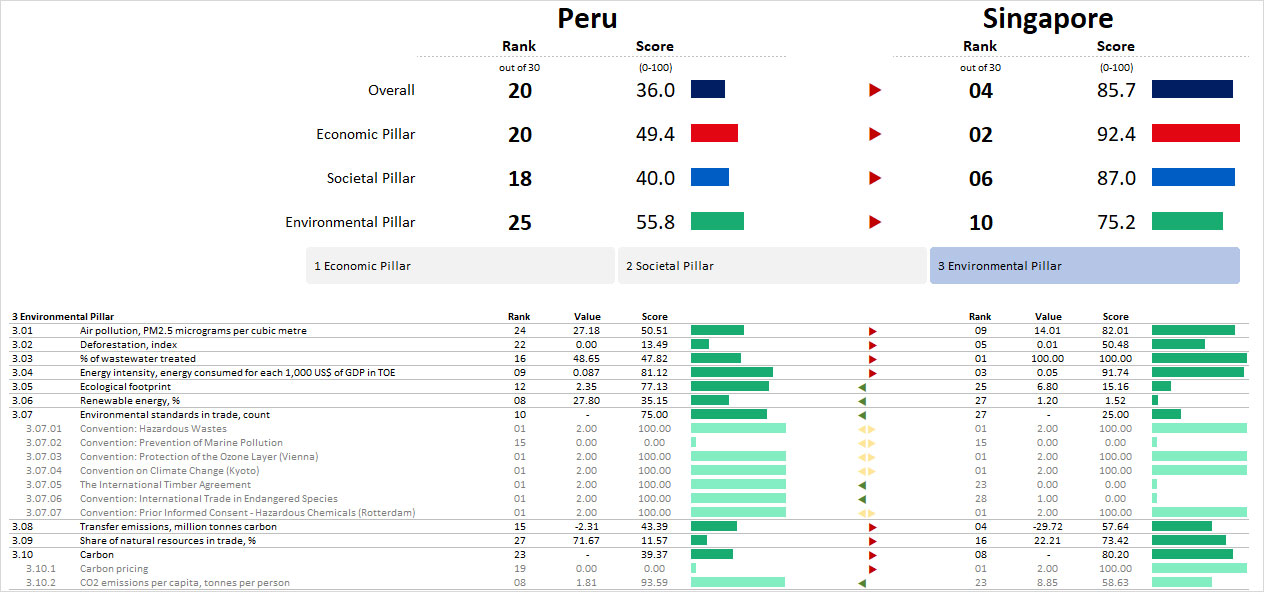
- The Peer Comparison tab provides the ability to select two economies for comparison across indicators in the economic, societal, and environmental pillars.
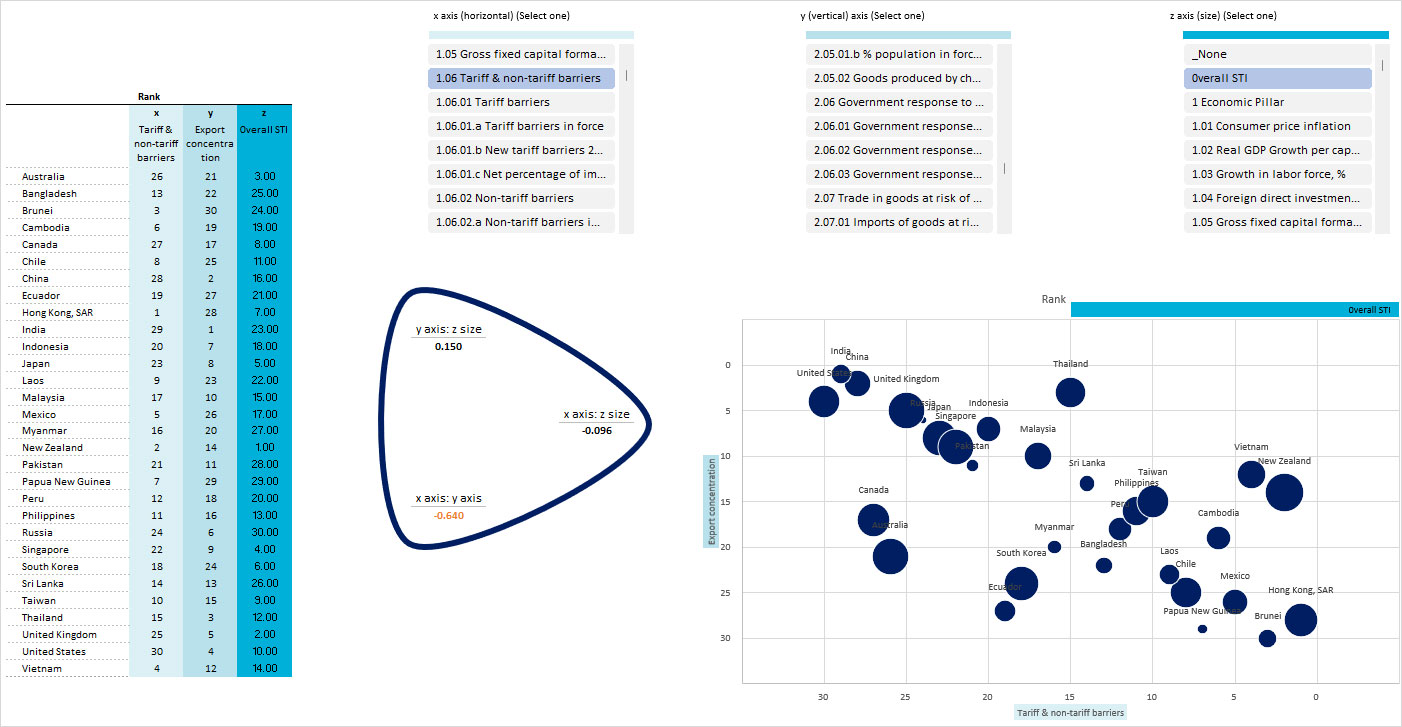
- Scatter plots can be created using the rank, score, and value of indicators included in the STI.
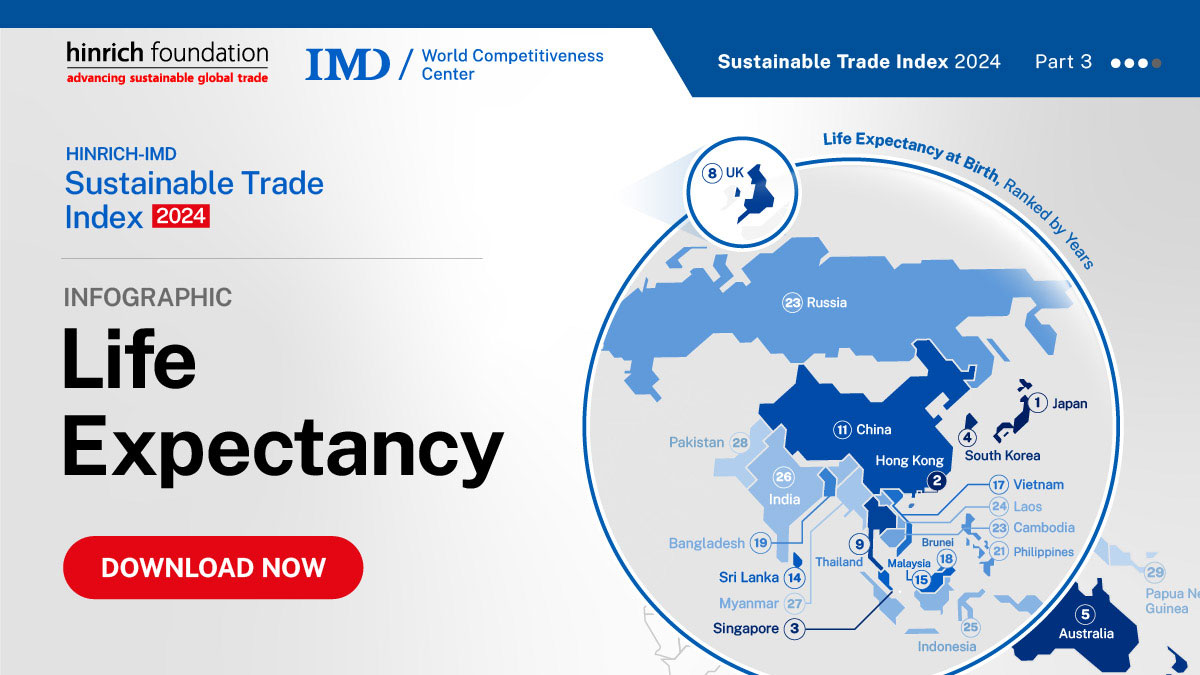
Infographics
Thematic visualizations of selected indicators produced in collaboration with Visual Capitalist are available for download.
 |
 |
How to apply the insights
- The STI 2024 report and interactive excel provide insights into recent trade trends and patterns identified in 30 trading economies. This helps policymakers understand their economy’s strengths and weaknesses in each pillar and tailor policies that enhance sustainable trade practices.
- The data and rankings which provide year-on-year and cross-economy comparisons can be used as a basis for research on sustainable trade and development.
Conclusion
Our annual Hinrich-IMD STI provides a framework for understanding and advancing sustainable trade. It enables stakeholders to make informed decisions that promote environmental stewardship, social equity, and economic resilience through a curated set of data and indicators. Whether applied in business, academia, or policymaking, STI is a tool for driving progress toward more sustainable and inclusive global trade.
Complementary reports and analysis
Hinrich Foundation
- Building a resilient trade system in a volatile world
- Leading the way to resilient global trade
- Sustainable Trade Index 2023
- Sustainable Trade Index 2022
External Resources
© The Hinrich Foundation. See our website Terms and conditions for our copyright and reprint policy. All statements of fact and the views, conclusions and recommendations expressed in this publication are the sole responsibility of the author(s).