Sustainable trade
Sustainable Trade Index 2022
Published 08 November 2022
The Hinrich-IMD Sustainable Trade Index (STI) measures how effectively 30 major trading economies are geared for long-term economic growth, environmental protection, and societal development across 70 indicators.
About the STI 2022
Geopolitical tensions and the global economic slowdown have made economies more inward-looking. The sustainability of trade must remain a fundamental objective of the international community to ensure long-term economic growth and value creation. This year’s STI, developed in partnership with IMD’s World Competitiveness Center, examines the key factors affecting these trends.
Overview of the STI 2022 findings
We summarize the key insights of the Sustainable Trade Index 2022 in a three-minute video. Find out who the top performers are and the factors of their success.
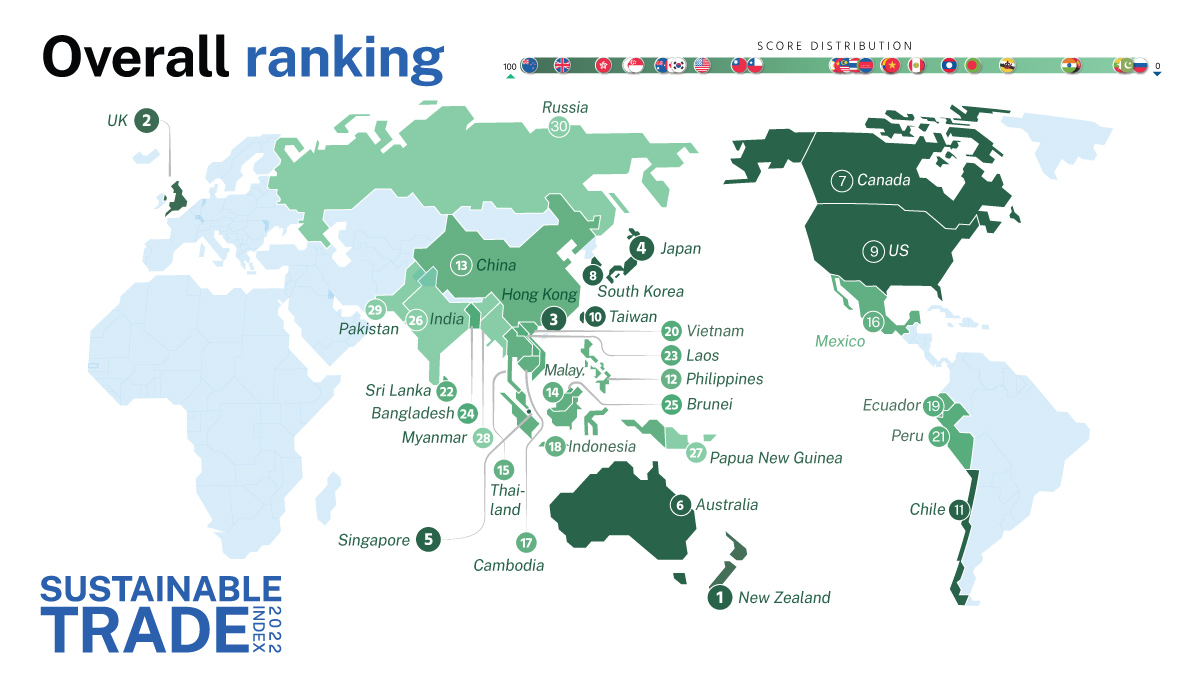
- New Zealand reached the top position of the overall STI by performing robustly in all Pillars. While it places 7th in the Economic Pillar, it takes the top spot in both the Societal and Environmental Pillars.
- Japan and South Korea which held the top spot in STI 2020, were ranked 4th and 8th respectively in this year’s index.
- A combination of technological innovation, robust macroeconomic fundamentals, and an open trade environment underline the performance of countries at the top of the Pillar rankings.
- Results among the top five economies show that a healthy population along with educational achievement in combination with social mobility characterize high-performing economies.
- Top economies also strive to reduce their carbon dioxide emissions and related externalities and ratify relevant environmental conventions. They also show efforts at reducing their energy consumption and their emissions.
The three pillars of sustainability
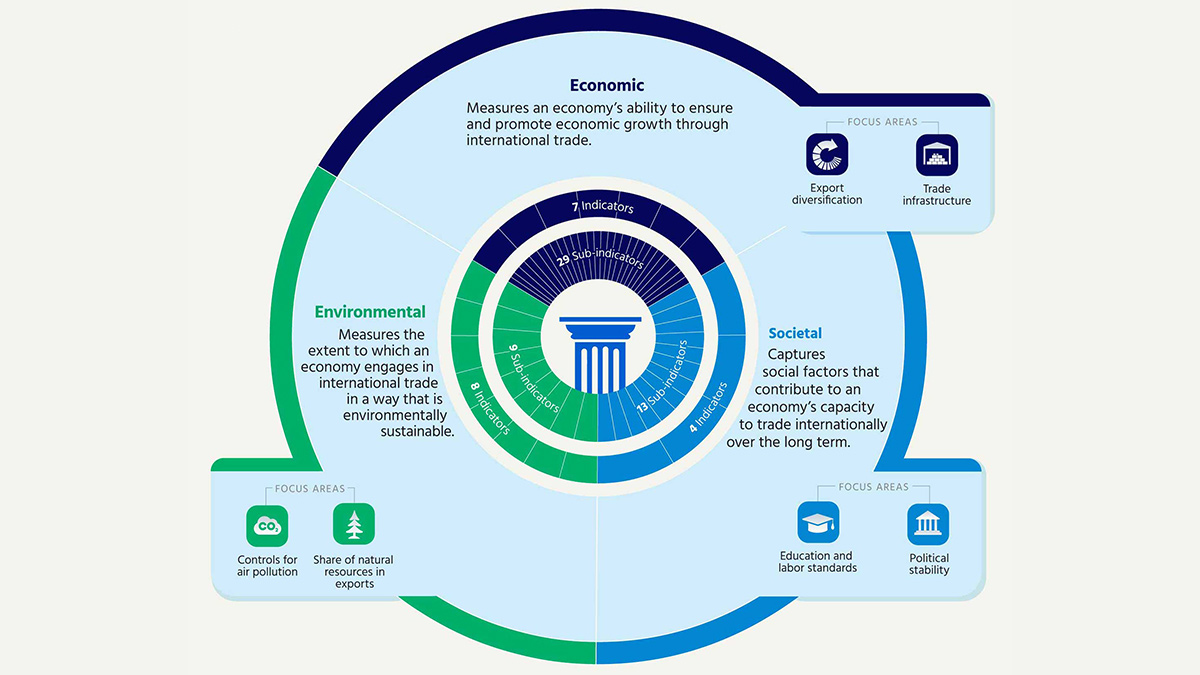
Each economy in the STI is scored across three pillars of trade sustainability – economic, societal, and environmental, which are supported by 70 individual indicators. Download the executive summary infographic and other resources to find out more.
Deep dives and graphics
Deep dives are standalone reports developed in partnership with leading global economic policy analysts and graphics specialists, that each focus on a specific theme impacting sustainable trade identified in the STI.
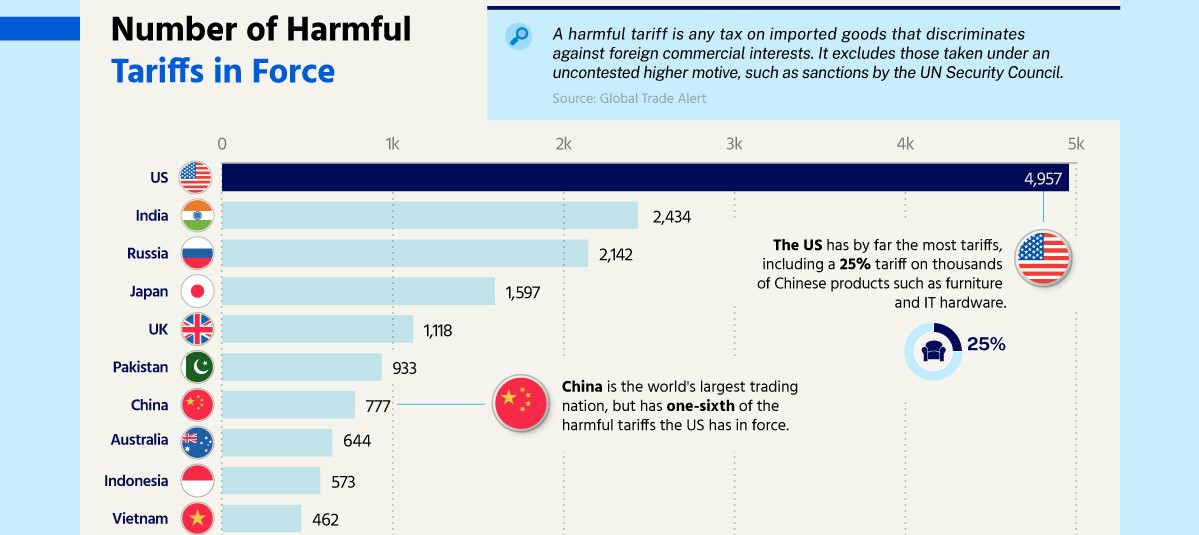
The infographics by Visual Capitalist will use data-driven visuals to provide an overview of some of the key themes and findings of STI 2022.
Learn more with our Sustainable Trade Index 2022 resources.
The Sustainable Trade Index 2022 dataset and economy-specific reports
The detailed results for the 30 economies reviewed in the STI are presented in the main report and an overview can be found in the Executive Summary. An interactive Excel workbook with the overall rankings and indicator rankings, and country profiles is also available for download.
Individual reports with focused highlights for each economy covered in the index are also available in our download pack.
| 1st | New Zealand | 16th | Mexico | |||
| 2nd | United Kingdom | 17th | Cambodia | |||
| 3rd | Hong Kong, SAR | 18th | Indonesia | |||
| 4th | Japan | 19th | Ecuador | |||
| 5th | Singapore | 20th | Vietnam | |||
| 6th | Australia | 21st | Peru | |||
| 7th | Canada | 22nd | Sri Lanka | |||
| 8th | South Korea | 23rd | Laos | |||
| 9th | United States | 24th | Bangladesh | |||
| 10th | Taiwan | 25th | Brunei | |||
| 11th | Chile | 26th | India | |||
| 12th | Philippines | 27th | Papua New Guinea | |||
| 13th | China | 28th | Myanmar | |||
| 14th | Malaysia | 29th | Pakistan | |||
| 15th | Thailand | 30th | Russia |
© The Hinrich Foundation. See our website Terms and conditions for our copyright and reprint policy. All statements of fact and the views, conclusions and recommendations expressed in this publication are the sole responsibility of the author(s).


